|
|


Share
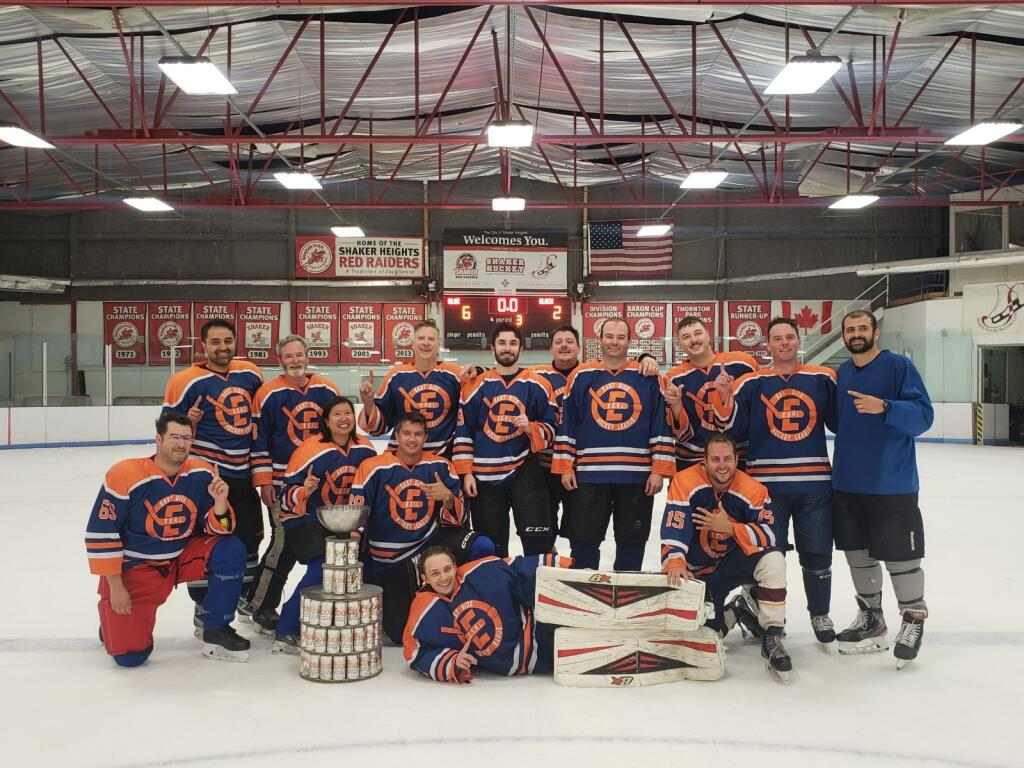
E.S.H.L. PLAYOFFS HOCKEY
SPRING 2024 POST SEASON LEAGUE
CONGRATULATIONS TO THE BLUE TEAM
EAST SIDE HOCKEY LEAGUE SPRING 2024 POST SEASON CHAMPIONS!!
CONGRATULATIONS TO THE BLACK TEAM
EAST SIDE HOCKEY LEAGUE SPRING 2024 POST SEASON RUNNERS-UP!!
6/ 9/24 | PRINTOUT #: 1
BLUE ( 3 - 0 - 0 )
Individual Team Statistics
|
Players |
GP |
G |
A |
PTS |
SOG |
SPCT |
PIM |
G/G |
A/G |
P/G |
S/G |
PIM/G |
HT |
PM |
GS |
LS |
| 1 . |
Jeff Deacon |
3 |
10 |
1 |
11 |
20 |
0.500 |
0 |
3.33 |
0.33 |
3.67 |
6.67 |
0.00 |
3 |
0 |
3 |
3 |
| 2 . |
Jacob Hoberman |
3 |
0 |
4 |
4 |
7 |
0.000 |
4 |
0.00 |
1.33 |
1.33 |
2.33 |
1.33 |
0 |
1 |
0 |
0 |
| 3 . |
Dan Brown |
3 |
0 |
3 |
3 |
8 |
0.000 |
0 |
0.00 |
1.00 |
1.00 |
2.67 |
0.00 |
0 |
0 |
0 |
0 |
| 4 . |
Jon Potrzeba |
3 |
2 |
1 |
3 |
10 |
0.200 |
2 |
0.67 |
0.33 |
1.00 |
3.33 |
0.67 |
0 |
0 |
1 |
1 |
| 5 . |
Brandon Bailey |
1 |
1 |
1 |
2 |
7 |
0.143 |
0 |
1.00 |
1.00 |
2.00 |
7.00 |
0.00 |
0 |
0 |
1 |
1 |
| 6 . |
Mark Wilson |
3 |
1 |
0 |
1 |
9 |
0.111 |
0 |
0.33 |
0.00 |
0.33 |
3.00 |
0.00 |
0 |
0 |
0 |
1 |
| 7 . |
Sub #28 |
1 |
1 |
0 |
1 |
2 |
0.500 |
2 |
1.00 |
0.00 |
1.00 |
2.00 |
2.00 |
0 |
0 |
1 |
1 |
| 8 . |
Sub #14 |
1 |
1 |
0 |
1 |
1 |
1.000 |
0 |
1.00 |
0.00 |
1.00 |
1.00 |
0.00 |
0 |
0 |
1 |
1 |
| 9 . |
Mark Grey |
3 |
1 |
0 |
1 |
7 |
0.143 |
4 |
0.33 |
0.00 |
0.33 |
2.33 |
1.33 |
0 |
0 |
1 |
1 |
| 10 . |
Dan Bacon |
3 |
0 |
1 |
1 |
8 |
0.000 |
4 |
0.00 |
0.33 |
0.33 |
2.67 |
1.33 |
0 |
0 |
0 |
0 |
| 11 . |
Jimmy Moore |
3 |
0 |
1 |
1 |
3 |
0.000 |
0 |
0.00 |
0.33 |
0.33 |
1.00 |
0.00 |
0 |
0 |
0 |
0 |
| 12 . |
Rich Garcia |
1 |
0 |
1 |
1 |
2 |
0.000 |
0 |
0.00 |
1.00 |
1.00 |
2.00 |
0.00 |
0 |
0 |
0 |
0 |
| 13 . |
Wes Deacon G |
3 |
0 |
0 |
0 |
0 |
0.000 |
0 |
0.00 |
0.00 |
0.00 |
0.33 |
0.00 |
0 |
0 |
0 |
0 |
| 14 . |
Jerry Thomas |
1 |
0 |
0 |
0 |
0 |
0.000 |
0 |
0.00 |
0.00 |
0.00 |
1.00 |
0.00 |
0 |
0 |
0 |
0 |
| 15 . |
Sumit Sharma |
1 |
0 |
0 |
0 |
0 |
0.000 |
2 |
0.00 |
0.00 |
0.00 |
1.00 |
2.00 |
0 |
0 |
0 |
0 |
| 16 . |
Karen Lingas |
3 |
0 |
0 |
0 |
5 |
0.000 |
0 |
0.00 |
0.00 |
0.00 |
1.67 |
0.00 |
0 |
0 |
0 |
0 |
| 17 . |
Seain Gallagher |
1 |
0 |
0 |
0 |
3 |
0.000 |
0 |
0.00 |
0.00 |
0.00 |
3.00 |
0.00 |
0 |
0 |
0 |
0 |
| |
TOTALS |
3 |
17 |
13 |
30 |
92 |
0.185 |
18 |
5.67 |
4.33 |
10.00 |
30.67 |
6.00 |
3 |
1 |
- |
- |
Individual Goalie Statistics
|
Players |
GP |
W |
L |
T |
GAA |
PER |
SV |
SV% |
SA |
GA |
SHO |
SA1 |
GA1 |
SA2 |
GA2 |
SA3 |
GA3 |
| 1 . |
Wes Deacon G |
3 |
3 |
0 |
0 |
1.67 |
9 |
91 |
0.948 |
96 |
5 |
0 |
30 |
2 |
32 |
1 |
34 |
2 |
| |
TOTALS |
3 |
0 |
0 |
0 |
1.67 |
0 |
91 |
0.948 |
96 |
5 |
0 |
30 |
2 |
32 |
1 |
34 |
2 |
Team Record: 3 - 0 - 0 (1.000
)
Game 1
6/ 2
6- 1
WHITE
AWAY |
Game 2
6/ 4
5- 2
YELLOW
AWAY |
Game 3
6/ 9
6- 2
BLACK
AWAY |
| Goals Scored |
Goals Allowed |
5.67
goals/game |
1.67
goals/game |
| Differential |
+4.00
goals/game |
| Power Play |
Penalty Kill |
1/ 2
power play |
7/ 8
penalty kill |
| PP% |
PK% |
50.0%
power play |
87.5%
penalty kill |
Goals by Period
Team Leaders
| Categories |
Players |
Statistics |
| GOALS |
Jeff Deacon |
10 |
| ASSISTS |
Jacob Hoberman |
4 |
| TOTAL POINTS |
Jeff Deacon |
11 |
| SHOTS ON GOAL |
Jeff Deacon |
20 |
| SHOOTING % |
Sub #14 |
1.000 |
| HAT TRICKS |
Jeff Deacon |
3 |
| PLAY MAKERS |
Jacob Hoberman |
1 |
| LONGEST SCORING STREAK |
Jeff Deacon |
3 |
| SHUTOUTS |
Jeff Deacon |
0 |
| GOALIE WINNING PCT. |
Wes Deacon G |
1.000 |
| GOALS AGAINST AVERAGE |
Wes Deacon G |
1.67 |
| SAVES PER GAME |
Wes Deacon G |
30.33 |
| SAVE PCT. |
Wes Deacon G |
0.948 |
Goalies need a minimum 1
games to qualify. Players need a min of 1 shot/game.
BLACK ( 2 - 1 - 0 )
Individual Team Statistics
|
Players |
GP |
G |
A |
PTS |
SOG |
SPCT |
PIM |
G/G |
A/G |
P/G |
S/G |
PIM/G |
HT |
PM |
GS |
LS |
| 1 . |
Ian Soble |
3 |
2 |
3 |
5 |
15 |
0.133 |
2 |
0.67 |
1.00 |
1.67 |
5.00 |
0.67 |
0 |
1 |
0 |
1 |
| 2 . |
Nate Christman |
3 |
2 |
3 |
5 |
17 |
0.118 |
2 |
0.67 |
1.00 |
1.67 |
5.67 |
0.67 |
0 |
0 |
0 |
2 |
| 3 . |
Tommy Elsmon |
3 |
2 |
2 |
4 |
8 |
0.250 |
2 |
0.67 |
0.67 |
1.33 |
2.67 |
0.67 |
0 |
0 |
0 |
2 |
| 4 . |
Jason Tehranisa |
3 |
2 |
1 |
3 |
16 |
0.125 |
0 |
0.67 |
0.33 |
1.00 |
5.33 |
0.00 |
0 |
0 |
0 |
1 |
| 5 . |
Jack Cross |
2 |
2 |
1 |
3 |
12 |
0.167 |
2 |
1.00 |
0.50 |
1.50 |
6.00 |
1.00 |
0 |
0 |
2 |
2 |
| 6 . |
Josh Heyka |
3 |
1 |
2 |
3 |
8 |
0.125 |
2 |
0.33 |
0.67 |
1.00 |
2.67 |
0.67 |
0 |
0 |
0 |
1 |
| 7 . |
Ryan Halpin |
1 |
0 |
1 |
1 |
0 |
0.000 |
0 |
0.00 |
1.00 |
1.00 |
1.00 |
0.00 |
0 |
0 |
0 |
0 |
| 8 . |
Matt Colclough |
1 |
1 |
0 |
1 |
12 |
0.083 |
0 |
1.00 |
0.00 |
1.00 |
%12.00 |
0.00 |
0 |
0 |
1 |
1 |
| 9 . |
Taylor Jacobs |
3 |
1 |
0 |
1 |
5 |
0.200 |
0 |
0.33 |
0.00 |
0.33 |
1.67 |
0.00 |
0 |
0 |
0 |
1 |
| 10 . |
Mark Knaus |
2 |
1 |
0 |
1 |
3 |
0.333 |
0 |
0.50 |
0.00 |
0.50 |
1.50 |
0.00 |
0 |
0 |
0 |
1 |
| 11 . |
Kevin Kreshover |
1 |
0 |
0 |
0 |
1 |
0.000 |
0 |
0.00 |
0.00 |
0.00 |
1.00 |
0.00 |
0 |
0 |
0 |
0 |
| 12 . |
Randle VanGorp |
1 |
0 |
0 |
0 |
3 |
0.000 |
0 |
0.00 |
0.00 |
0.00 |
3.00 |
0.00 |
0 |
0 |
0 |
0 |
| 13 . |
Steve Warshawsky |
2 |
0 |
0 |
0 |
1 |
0.000 |
0 |
0.00 |
0.00 |
0.00 |
0.50 |
0.00 |
0 |
0 |
0 |
0 |
| 14 . |
Grant Passell G |
3 |
0 |
0 |
0 |
0 |
0.000 |
0 |
0.00 |
0.00 |
0.00 |
0.33 |
0.00 |
0 |
0 |
0 |
0 |
| 15 . |
Halle Cole |
2 |
0 |
0 |
0 |
1 |
0.000 |
0 |
0.00 |
0.00 |
0.00 |
0.50 |
0.00 |
0 |
0 |
0 |
0 |
| |
TOTALS |
3 |
14 |
13 |
27 |
102 |
0.137 |
10 |
4.67 |
4.33 |
9.00 |
34.00 |
3.33 |
0 |
1 |
- |
- |
Individual Goalie Statistics
|
Players |
GP |
W |
L |
T |
GAA |
PER |
SV |
SV% |
SA |
GA |
SHO |
SA1 |
GA1 |
SA2 |
GA2 |
SA3 |
GA3 |
| 1 . |
Grant Passell G |
3 |
2 |
1 |
0 |
4.00 |
9 |
74 |
0.860 |
86 |
12 |
0 |
27 |
5 |
31 |
5 |
28 |
2 |
| |
TOTALS |
3 |
0 |
0 |
0 |
4.00 |
0 |
74 |
0.860 |
86 |
12 |
0 |
27 |
5 |
31 |
5 |
28 |
2 |
Team Record: 2 - 1 - 0 (0.667
)
Game 1
6/ 2
8- 4
RED
HOME |
Game 2
6/ 6
4- 2
GREEN
AWAY |
Game 3
6/ 9
2- 6
BLUE
HOME |
| Goals Scored |
Goals Allowed |
4.67
goals/game |
4.00
goals/game |
| Differential |
+0.67
goals/game |
| Power Play |
Penalty Kill |
1/ 7
power play |
1/ 4
penalty kill |
| PP% |
PK% |
14.3%
power play |
25.0%
penalty kill |
Goals by Period
Team Leaders
| Categories |
Players |
Statistics |
| GOALS |
5 players are tied with |
2 |
| ASSISTS |
Nate Christman , Ian Soble |
3 |
| TOTAL POINTS |
Nate Christman , Ian Soble |
5 |
| SHOTS ON GOAL |
Nate Christman |
17 |
| SHOOTING % |
Mark Knaus |
0.333 |
| HAT TRICKS |
Mark Knaus |
0 |
| PLAY MAKERS |
Ian Soble |
1 |
| LONGEST SCORING STREAK |
Nate Christman , Jack Cross , Tommy Elsmon |
2 |
| SHUTOUTS |
Nate Christman |
0 |
| GOALIE WINNING PCT. |
Grant Passell G |
0.667 |
| GOALS AGAINST AVERAGE |
Grant Passell G |
4.00 |
| SAVES PER GAME |
Grant Passell G |
24.67 |
| SAVE PCT. |
Grant Passell G |
0.860 |
Goalies need a minimum 1
games to qualify. Players need a min of 1 shot/game.
GREEN ( 0 - 1 - 0 )
Individual Team Statistics
|
Players |
GP |
G |
A |
PTS |
SOG |
SPCT |
PIM |
G/G |
A/G |
P/G |
S/G |
PIM/G |
HT |
PM |
GS |
LS |
| 1 . |
Andrew Wisniewski |
1 |
1 |
0 |
1 |
5 |
0.200 |
0 |
1.00 |
0.00 |
1.00 |
5.00 |
0.00 |
0 |
0 |
1 |
1 |
| 2 . |
Brian O'Neill |
1 |
0 |
1 |
1 |
7 |
0.000 |
0 |
0.00 |
1.00 |
1.00 |
7.00 |
0.00 |
0 |
0 |
0 |
0 |
| 3 . |
Brandon Henning |
1 |
1 |
0 |
1 |
5 |
0.200 |
2 |
1.00 |
0.00 |
1.00 |
5.00 |
2.00 |
0 |
0 |
1 |
1 |
| 4 . |
Monica Korzon |
1 |
0 |
1 |
1 |
0 |
0.000 |
0 |
0.00 |
1.00 |
1.00 |
1.00 |
0.00 |
0 |
0 |
0 |
0 |
| 5 . |
Dave Kresnye G |
1 |
0 |
0 |
0 |
0 |
0.000 |
0 |
0.00 |
0.00 |
0.00 |
1.00 |
0.00 |
0 |
0 |
0 |
0 |
| 6 . |
John Sullivan |
1 |
0 |
0 |
0 |
1 |
0.000 |
0 |
0.00 |
0.00 |
0.00 |
1.00 |
0.00 |
0 |
0 |
0 |
0 |
| 7 . |
Mike Fellenbaum |
1 |
0 |
0 |
0 |
1 |
0.000 |
2 |
0.00 |
0.00 |
0.00 |
1.00 |
2.00 |
0 |
0 |
0 |
0 |
| 8 . |
Reid Anderson |
1 |
0 |
0 |
0 |
1 |
0.000 |
0 |
0.00 |
0.00 |
0.00 |
1.00 |
0.00 |
0 |
0 |
0 |
0 |
| 9 . |
Mark Henning |
1 |
0 |
0 |
0 |
2 |
0.000 |
0 |
0.00 |
0.00 |
0.00 |
2.00 |
0.00 |
0 |
0 |
0 |
0 |
| 10 . |
Andrew Bruening-W |
1 |
0 |
0 |
0 |
2 |
0.000 |
0 |
0.00 |
0.00 |
0.00 |
2.00 |
0.00 |
0 |
0 |
0 |
0 |
| 11 . |
Wiley Miller |
1 |
0 |
0 |
0 |
2 |
0.000 |
4 |
0.00 |
0.00 |
0.00 |
2.00 |
4.00 |
0 |
0 |
0 |
0 |
| 12 . |
Paul Oppedar |
1 |
0 |
0 |
0 |
0 |
0.000 |
0 |
0.00 |
0.00 |
0.00 |
1.00 |
0.00 |
0 |
0 |
0 |
0 |
| |
TOTALS |
1 |
2 |
2 |
4 |
26 |
0.077 |
8 |
2.00 |
2.00 |
4.00 |
26.00 |
8.00 |
0 |
0 |
- |
- |
Individual Goalie Statistics
|
Players |
GP |
W |
L |
T |
GAA |
PER |
SV |
SV% |
SA |
GA |
SHO |
SA1 |
GA1 |
SA2 |
GA2 |
SA3 |
GA3 |
| 1 . |
Dave Kresnye G |
1 |
0 |
1 |
0 |
4.00 |
3 |
16 |
0.800 |
20 |
4 |
0 |
6 |
1 |
9 |
2 |
5 |
1 |
| |
TOTALS |
1 |
0 |
0 |
0 |
4.00 |
0 |
16 |
0.800 |
20 |
4 |
0 |
6 |
1 |
9 |
2 |
5 |
1 |
Team Record: 0 - 1 - 0 (0.000
)
Game 1
6/ 6
2- 4
BLACK
HOME |
| Goals Scored |
Goals Allowed |
2.00
goals/game |
4.00
goals/game |
| Differential |
-2.00
goals/game |
| Power Play |
Penalty Kill |
0/ 0
power play |
2/ 3
penalty kill |
| PP% |
PK% |
0.0%
power play |
66.7%
penalty kill |
Goals by Period
Team Leaders
| Categories |
Players |
Statistics |
| GOALS |
Brandon Henning , Andrew Wisniewski |
1 |
| ASSISTS |
Monica Korzon , Brian O'Neill |
1 |
| TOTAL POINTS |
4 players are tied with |
1 |
| SHOTS ON GOAL |
Brian O'Neill |
7 |
| SHOOTING % |
Brandon Henning , Andrew Wisniewski |
0.200 |
| HAT TRICKS |
Brandon Henning |
0 |
| PLAY MAKERS |
Brandon Henning |
0 |
| LONGEST SCORING STREAK |
Brandon Henning , Andrew Wisniewski |
1 |
| SHUTOUTS |
Brandon Henning |
0 |
| GOALIE WINNING PCT. |
Brandon Henning |
***** |
| GOALS AGAINST AVERAGE |
Dave Kresnye G |
4.00 |
| SAVES PER GAME |
Dave Kresnye G |
16.00 |
| SAVE PCT. |
Dave Kresnye G |
0.800 |
Goalies need a minimum 0
games to qualify. Players need a min of 1 shot/game.
WHITE ( 0 - 1 - 0 )
Individual Team Statistics
|
Players |
GP |
G |
A |
PTS |
SOG |
SPCT |
PIM |
G/G |
A/G |
P/G |
S/G |
PIM/G |
HT |
PM |
GS |
LS |
| 1 . |
Brian Bradley |
1 |
0 |
1 |
1 |
2 |
0.000 |
0 |
0.00 |
1.00 |
1.00 |
2.00 |
0.00 |
0 |
0 |
0 |
0 |
| 2 . |
Joey Morford |
1 |
1 |
0 |
1 |
3 |
0.333 |
0 |
1.00 |
0.00 |
1.00 |
3.00 |
0.00 |
0 |
0 |
1 |
1 |
| 3 . |
Glenn Shtarkman |
1 |
0 |
0 |
0 |
2 |
0.000 |
0 |
0.00 |
0.00 |
0.00 |
2.00 |
0.00 |
0 |
0 |
0 |
0 |
| 4 . |
Justin Wolf |
1 |
0 |
0 |
0 |
2 |
0.000 |
0 |
0.00 |
0.00 |
0.00 |
2.00 |
0.00 |
0 |
0 |
0 |
0 |
| 5 . |
Frank Theiss G |
1 |
0 |
0 |
0 |
0 |
0.000 |
0 |
0.00 |
0.00 |
0.00 |
1.00 |
0.00 |
0 |
0 |
0 |
0 |
| 6 . |
Joel Chetner |
1 |
0 |
0 |
0 |
2 |
0.000 |
0 |
0.00 |
0.00 |
0.00 |
2.00 |
0.00 |
0 |
0 |
0 |
0 |
| 7 . |
John Koppitch |
1 |
0 |
0 |
0 |
2 |
0.000 |
0 |
0.00 |
0.00 |
0.00 |
2.00 |
0.00 |
0 |
0 |
0 |
0 |
| 8 . |
Noah Leavitt |
1 |
0 |
0 |
0 |
2 |
0.000 |
0 |
0.00 |
0.00 |
0.00 |
2.00 |
0.00 |
0 |
0 |
0 |
0 |
| 9 . |
Mike Lukegord |
1 |
0 |
0 |
0 |
1 |
0.000 |
0 |
0.00 |
0.00 |
0.00 |
1.00 |
0.00 |
0 |
0 |
0 |
0 |
| 10 . |
Anthony Bokar |
1 |
0 |
0 |
0 |
2 |
0.000 |
0 |
0.00 |
0.00 |
0.00 |
2.00 |
0.00 |
0 |
0 |
0 |
0 |
| 11 . |
Max Morford |
1 |
0 |
0 |
0 |
1 |
0.000 |
0 |
0.00 |
0.00 |
0.00 |
1.00 |
0.00 |
0 |
0 |
0 |
0 |
| 12 . |
Evan Nolan |
1 |
0 |
0 |
0 |
2 |
0.000 |
2 |
0.00 |
0.00 |
0.00 |
2.00 |
2.00 |
0 |
0 |
0 |
0 |
| 13 . |
Nate Schatzman |
1 |
0 |
0 |
0 |
1 |
0.000 |
0 |
0.00 |
0.00 |
0.00 |
1.00 |
0.00 |
0 |
0 |
0 |
0 |
| |
TOTALS |
1 |
1 |
1 |
2 |
22 |
0.045 |
2 |
1.00 |
1.00 |
2.00 |
22.00 |
2.00 |
0 |
0 |
- |
- |
Individual Goalie Statistics
|
Players |
GP |
W |
L |
T |
GAA |
PER |
SV |
SV% |
SA |
GA |
SHO |
SA1 |
GA1 |
SA2 |
GA2 |
SA3 |
GA3 |
| 1 . |
Frank Theiss G |
1 |
0 |
1 |
0 |
6.00 |
3 |
25 |
0.806 |
31 |
6 |
0 |
10 |
2 |
10 |
1 |
11 |
3 |
| |
TOTALS |
1 |
0 |
0 |
0 |
6.00 |
0 |
25 |
0.806 |
31 |
6 |
0 |
10 |
2 |
10 |
1 |
11 |
3 |
Team Record: 0 - 1 - 0 (0.000
)
Game 1
6/ 2
1- 6
BLUE
HOME |
| Goals Scored |
Goals Allowed |
1.00
goals/game |
6.00
goals/game |
| Differential |
-5.00
goals/game |
| Power Play |
Penalty Kill |
0/ 4
power play |
1/ 1
penalty kill |
| PP% |
PK% |
0.0%
power play |
100.0%
penalty kill |
Goals by Period
Team Leaders
| Categories |
Players |
Statistics |
| GOALS |
Joey Morford |
1 |
| ASSISTS |
Brian Bradley |
1 |
| TOTAL POINTS |
Brian Bradley , Joey Morford |
1 |
| SHOTS ON GOAL |
Joey Morford |
3 |
| SHOOTING % |
Joey Morford |
0.333 |
| HAT TRICKS |
Joey Morford |
0 |
| PLAY MAKERS |
Joey Morford |
0 |
| LONGEST SCORING STREAK |
Joey Morford |
1 |
| SHUTOUTS |
Joey Morford |
0 |
| GOALIE WINNING PCT. |
Joey Morford |
***** |
| GOALS AGAINST AVERAGE |
Frank Theiss G |
6.00 |
| SAVES PER GAME |
Frank Theiss G |
25.00 |
| SAVE PCT. |
Frank Theiss G |
0.806 |
Goalies need a minimum 0
games to qualify. Players need a min of 1 shot/game.
YELLOW ( 0 - 1 - 0 )
Individual Team Statistics
|
Players |
GP |
G |
A |
PTS |
SOG |
SPCT |
PIM |
G/G |
A/G |
P/G |
S/G |
PIM/G |
HT |
PM |
GS |
LS |
| 1 . |
Andrew Haffner |
1 |
2 |
0 |
2 |
5 |
0.400 |
0 |
2.00 |
0.00 |
2.00 |
5.00 |
0.00 |
0 |
0 |
1 |
1 |
| 2 . |
Sean Collings |
1 |
0 |
1 |
1 |
3 |
0.000 |
0 |
0.00 |
1.00 |
1.00 |
3.00 |
0.00 |
0 |
0 |
0 |
0 |
| 3 . |
Jon Rice |
1 |
0 |
0 |
0 |
2 |
0.000 |
0 |
0.00 |
0.00 |
0.00 |
2.00 |
0.00 |
0 |
0 |
0 |
0 |
| 4 . |
Bill Scanlon |
1 |
0 |
0 |
0 |
2 |
0.000 |
0 |
0.00 |
0.00 |
0.00 |
2.00 |
0.00 |
0 |
0 |
0 |
0 |
| 5 . |
BJ Solaru |
1 |
0 |
0 |
0 |
1 |
0.000 |
0 |
0.00 |
0.00 |
0.00 |
1.00 |
0.00 |
0 |
0 |
0 |
0 |
| 6 . |
Yi Wang G |
1 |
0 |
0 |
0 |
0 |
0.000 |
0 |
0.00 |
0.00 |
0.00 |
1.00 |
0.00 |
0 |
0 |
0 |
0 |
| 7 . |
Brandon Detzel |
1 |
0 |
0 |
0 |
1 |
0.000 |
0 |
0.00 |
0.00 |
0.00 |
1.00 |
0.00 |
0 |
0 |
0 |
0 |
| 8 . |
Brad Forward |
1 |
0 |
0 |
0 |
3 |
0.000 |
0 |
0.00 |
0.00 |
0.00 |
3.00 |
0.00 |
0 |
0 |
0 |
0 |
| 9 . |
Aaron Gerds |
1 |
0 |
0 |
0 |
2 |
0.000 |
0 |
0.00 |
0.00 |
0.00 |
2.00 |
0.00 |
0 |
0 |
0 |
0 |
| 10 . |
Mike Borden |
1 |
0 |
0 |
0 |
1 |
0.000 |
0 |
0.00 |
0.00 |
0.00 |
1.00 |
0.00 |
0 |
0 |
0 |
0 |
| 11 . |
Jeff Hammel |
1 |
0 |
0 |
0 |
2 |
0.000 |
0 |
0.00 |
0.00 |
0.00 |
2.00 |
0.00 |
0 |
0 |
0 |
0 |
| 12 . |
Lilly Hammel |
1 |
0 |
0 |
0 |
2 |
0.000 |
0 |
0.00 |
0.00 |
0.00 |
2.00 |
0.00 |
0 |
0 |
0 |
0 |
| 13 . |
Pat Miller |
1 |
0 |
0 |
0 |
1 |
0.000 |
0 |
0.00 |
0.00 |
0.00 |
1.00 |
0.00 |
0 |
0 |
0 |
0 |
| |
TOTALS |
1 |
2 |
1 |
3 |
25 |
0.080 |
0 |
2.00 |
1.00 |
3.00 |
25.00 |
0.00 |
0 |
0 |
- |
- |
Individual Goalie Statistics
|
Players |
GP |
W |
L |
T |
GAA |
PER |
SV |
SV% |
SA |
GA |
SHO |
SA1 |
GA1 |
SA2 |
GA2 |
SA3 |
GA3 |
| 1 . |
Yi Wang G |
1 |
0 |
1 |
0 |
5.00 |
3 |
25 |
0.833 |
30 |
5 |
0 |
13 |
4 |
8 |
0 |
9 |
1 |
| |
TOTALS |
1 |
0 |
0 |
0 |
5.00 |
0 |
25 |
0.833 |
30 |
5 |
0 |
13 |
4 |
8 |
0 |
9 |
1 |
Team Record: 0 - 1 - 0 (0.000
)
Game 1
6/ 4
2- 5
BLUE
HOME |
| Goals Scored |
Goals Allowed |
2.00
goals/game |
5.00
goals/game |
| Differential |
-3.00
goals/game |
| Power Play |
Penalty Kill |
1/ 1
power play |
0/ 0
penalty kill |
| PP% |
PK% |
100.0%
power play |
0.0%
penalty kill |
Goals by Period
Team Leaders
| Categories |
Players |
Statistics |
| GOALS |
Andrew Haffner |
2 |
| ASSISTS |
Sean Collings |
1 |
| TOTAL POINTS |
Andrew Haffner |
2 |
| SHOTS ON GOAL |
Andrew Haffner |
5 |
| SHOOTING % |
Andrew Haffner |
0.400 |
| HAT TRICKS |
Andrew Haffner |
0 |
| PLAY MAKERS |
Andrew Haffner |
0 |
| LONGEST SCORING STREAK |
Andrew Haffner |
1 |
| SHUTOUTS |
Andrew Haffner |
0 |
| GOALIE WINNING PCT. |
Andrew Haffner |
***** |
| GOALS AGAINST AVERAGE |
Yi Wang G |
5.00 |
| SAVES PER GAME |
Yi Wang G |
25.00 |
| SAVE PCT. |
Yi Wang G |
0.833 |
Goalies need a minimum 0
games to qualify. Players need a min of 1 shot/game.
RED ( 0 - 1 - 0 )
Individual Team Statistics
|
Players |
GP |
G |
A |
PTS |
SOG |
SPCT |
PIM |
G/G |
A/G |
P/G |
S/G |
PIM/G |
HT |
PM |
GS |
LS |
| 1 . |
Angelo Nero |
1 |
0 |
2 |
2 |
2 |
0.000 |
0 |
0.00 |
2.00 |
2.00 |
2.00 |
0.00 |
0 |
0 |
0 |
0 |
| 2 . |
Charles Huse |
1 |
2 |
0 |
2 |
3 |
0.667 |
0 |
2.00 |
0.00 |
2.00 |
3.00 |
0.00 |
0 |
0 |
1 |
1 |
| 3 . |
Justin Vance |
1 |
1 |
1 |
2 |
4 |
0.250 |
0 |
1.00 |
1.00 |
2.00 |
4.00 |
0.00 |
0 |
0 |
1 |
1 |
| 4 . |
Joe Nicoletti |
1 |
1 |
0 |
1 |
4 |
0.250 |
0 |
1.00 |
0.00 |
1.00 |
4.00 |
0.00 |
0 |
0 |
1 |
1 |
| 5 . |
Chris Holden |
1 |
0 |
1 |
1 |
3 |
0.000 |
0 |
0.00 |
1.00 |
1.00 |
3.00 |
0.00 |
0 |
0 |
0 |
0 |
| 6 . |
Pete Ehlers G |
1 |
0 |
0 |
0 |
0 |
0.000 |
0 |
0.00 |
0.00 |
0.00 |
1.00 |
0.00 |
0 |
0 |
0 |
0 |
| 7 . |
Jeff Hindulak |
1 |
0 |
0 |
0 |
2 |
0.000 |
2 |
0.00 |
0.00 |
0.00 |
2.00 |
2.00 |
0 |
0 |
0 |
0 |
| 8 . |
Matt Bachovchin |
1 |
0 |
0 |
0 |
2 |
0.000 |
0 |
0.00 |
0.00 |
0.00 |
2.00 |
0.00 |
0 |
0 |
0 |
0 |
| 9 . |
Joe Burgess |
1 |
0 |
0 |
0 |
1 |
0.000 |
0 |
0.00 |
0.00 |
0.00 |
1.00 |
0.00 |
0 |
0 |
0 |
0 |
| 10 . |
Matt Metzler |
1 |
0 |
0 |
0 |
1 |
0.000 |
0 |
0.00 |
0.00 |
0.00 |
1.00 |
0.00 |
0 |
0 |
0 |
0 |
| 11 . |
Mike Metzler |
1 |
0 |
0 |
0 |
1 |
0.000 |
0 |
0.00 |
0.00 |
0.00 |
1.00 |
0.00 |
0 |
0 |
0 |
0 |
| 12 . |
Craig Caroff |
1 |
0 |
0 |
0 |
1 |
0.000 |
0 |
0.00 |
0.00 |
0.00 |
1.00 |
0.00 |
0 |
0 |
0 |
0 |
| 13 . |
Scott Consaul |
1 |
0 |
0 |
0 |
3 |
0.000 |
0 |
0.00 |
0.00 |
0.00 |
3.00 |
0.00 |
0 |
0 |
0 |
0 |
| |
TOTALS |
1 |
4 |
4 |
8 |
27 |
0.148 |
2 |
4.00 |
4.00 |
8.00 |
27.00 |
2.00 |
0 |
0 |
- |
- |
Individual Goalie Statistics
|
Players |
GP |
W |
L |
T |
GAA |
PER |
SV |
SV% |
SA |
GA |
SHO |
SA1 |
GA1 |
SA2 |
GA2 |
SA3 |
GA3 |
| 1 . |
Pete Ehlers G |
1 |
0 |
1 |
0 |
8.00 |
3 |
26 |
0.765 |
34 |
8 |
0 |
10 |
1 |
11 |
2 |
13 |
5 |
| |
TOTALS |
1 |
0 |
0 |
0 |
8.00 |
0 |
26 |
0.765 |
34 |
8 |
0 |
10 |
1 |
11 |
2 |
13 |
5 |
Team Record: 0 - 1 - 0 (0.000
)
Game 1
6/ 2
4- 8
BLACK
AWAY |
| Goals Scored |
Goals Allowed |
4.00
goals/game |
8.00
goals/game |
| Differential |
-4.00
goals/game |
| Power Play |
Penalty Kill |
2/ 3
power play |
1/ 1
penalty kill |
| PP% |
PK% |
66.7%
power play |
100.0%
penalty kill |
Goals by Period
Team Leaders
| Categories |
Players |
Statistics |
| GOALS |
Charles Huse |
2 |
| ASSISTS |
Angelo Nero |
2 |
| TOTAL POINTS |
Charles Huse , Justin Vance , Angelo Nero |
2 |
| SHOTS ON GOAL |
Joe Nicoletti , Justin Vance |
4 |
| SHOOTING % |
Charles Huse |
0.667 |
| HAT TRICKS |
Charles Huse |
0 |
| PLAY MAKERS |
Charles Huse |
0 |
| LONGEST SCORING STREAK |
Charles Huse , Joe Nicoletti , Justin Vance |
1 |
| SHUTOUTS |
Charles Huse |
0 |
| GOALIE WINNING PCT. |
Charles Huse |
***** |
| GOALS AGAINST AVERAGE |
Pete Ehlers G |
8.00 |
| SAVES PER GAME |
Pete Ehlers G |
26.00 |
| SAVE PCT. |
Pete Ehlers G |
0.765 |
Goalies need a minimum 0
games to qualify. Players need a min of 1 shot/game.
Team Standings
6/ 9/24 | PRINTOUT #: 1
| Teams |
GP |
W |
L |
T |
GS/G |
GA/G |
GD/G |
PCT |
LWS |
PS |
PTS |
| 1. BLUE |
3 |
3 |
0 |
0 |
5.7 |
1.7 |
+4.0 |
1.000 |
3 |
3W |
6 |
| 2. BLACK |
3 |
2 |
1 |
0 |
4.7 |
4.0 |
+0.7 |
0.667 |
2 |
1L |
4 |
| 3. GREEN |
1 |
0 |
1 |
0 |
2.0 |
4.0 |
-2.0 |
0.000 |
0 |
1L |
0 |
| 4. WHITE |
1 |
0 |
1 |
0 |
1.0 |
6.0 |
-5.0 |
0.000 |
0 |
1L |
0 |
| 5. YELLOW |
1 |
0 |
1 |
0 |
2.0 |
5.0 |
-3.0 |
0.000 |
0 |
1L |
0 |
| 6. RED |
1 |
0 |
1 |
0 |
4.0 |
8.0 |
-4.0 |
0.000 |
0 |
1L |
0 |
Back to Top Team Statistics
| TEAMS |
GP |
GS |
GA |
A |
PTS |
HT |
PM |
PIM |
PIM/G |
PP |
PP% |
PK |
PK% |
SHG |
SV |
SA |
SV% |
| 1. BLUE |
3 |
17
|
5
|
13
|
30
|
3 |
1 |
18 |
6.0 |
1 / 2 |
50.0% |
7 / 8 |
87.5% |
0 |
91
|
96
|
0.948
|
| 2. BLACK |
3 |
14
|
12
|
13
|
27
|
0 |
1 |
10 |
3.3 |
1 / 7 |
14.3% |
1 / 4 |
25.0% |
0 |
74
|
86
|
0.860
|
| 3. RED |
1 |
4
|
8
|
4
|
8
|
0 |
0 |
2 |
2.0 |
2 / 3 |
66.7% |
1 / 1 |
100.0% |
0 |
26
|
34
|
0.765
|
| 4. YELLOW |
1 |
2
|
5
|
1
|
3
|
0 |
0 |
0 |
0.0 |
1 / 1 |
100.0% |
0 / 0 |
0.0% |
0 |
25
|
30
|
0.833
|
| 5. GREEN |
1 |
2
|
4
|
2
|
4
|
0 |
0 |
8 |
8.0 |
0 / 0 |
0.0% |
2 / 3 |
66.7% |
0 |
16
|
20
|
0.800
|
| 6. WHITE |
1 |
1
|
6
|
1
|
2
|
0 |
0 |
2 |
2.0 |
0 / 4 |
0.0% |
1 / 1 |
100.0% |
0 |
25
|
31
|
0.806
|
Back to Top
Individual League Leaders
Goals
|
Players |
Team |
GP |
G |
G/GP |
| 1. |
Jeff Deacon |
BLUE |
3
|
10
|
3.33
|
| 2. |
Tommy Elsmon |
BLACK |
3
|
2
|
0.67
|
| 3. |
Ian Soble |
BLACK |
3
|
2
|
0.67
|
| 4. |
Jason Tehranisa |
BLACK |
3
|
2
|
0.67
|
| 5. |
Andrew Haffner |
YELLOW |
1
|
2
|
2.00
|
| 6. |
Charles Huse |
RED |
1
|
2
|
2.00
|
| 7. |
Jon Potrzeba |
BLUE |
3
|
2
|
0.67
|
| 8. |
Nate Christman |
BLACK |
3
|
2
|
0.67
|
| 9. |
Jack Cross |
BLACK |
2
|
2
|
1.00
|
| 10. |
Josh Heyka |
BLACK |
3
|
1
|
0.33
|
| 11. |
Taylor Jacobs |
BLACK |
3
|
1
|
0.33
|
| 12. |
Brandon Henning |
GREEN |
1
|
1
|
1.00
|
| 13. |
Andrew Wisniewski |
GREEN |
1
|
1
|
1.00
|
| 14. |
Joey Morford |
WHITE |
1
|
1
|
1.00
|
| 15. |
Mark Knaus |
BLACK |
2
|
1
|
0.50
|
| 16. |
Sub #28 |
BLUE |
1
|
1
|
1.00
|
| 17. |
Sub #14 |
BLUE |
1
|
1
|
1.00
|
| 18. |
Mark Grey |
BLUE |
3
|
1
|
0.33
|
| 19. |
Matt Colclough |
BLACK |
1
|
1
|
1.00
|
| 20. |
Mark Wilson |
BLUE |
3
|
1
|
0.33
|
Back to Top Assists
|
Players |
Team |
GP |
A |
A/GP |
| 1. |
Jacob Hoberman |
BLUE |
3
|
4
|
1.33
|
| 2. |
Ian Soble |
BLACK |
3
|
3
|
1.00
|
| 3. |
Dan Brown |
BLUE |
3
|
3
|
1.00
|
| 4. |
Nate Christman |
BLACK |
3
|
3
|
1.00
|
| 5. |
Josh Heyka |
BLACK |
3
|
2
|
0.67
|
| 6. |
Tommy Elsmon |
BLACK |
3
|
2
|
0.67
|
| 7. |
Angelo Nero |
RED |
1
|
2
|
2.00
|
| 8. |
Ryan Halpin |
BLACK |
1
|
1
|
1.00
|
| 9. |
Jason Tehranisa |
BLACK |
3
|
1
|
0.33
|
| 10. |
Monica Korzon |
GREEN |
1
|
1
|
1.00
|
| 11. |
Brian O'Neill |
GREEN |
1
|
1
|
1.00
|
| 12. |
Brian Bradley |
WHITE |
1
|
1
|
1.00
|
| 13. |
Sean Collings |
YELLOW |
1
|
1
|
1.00
|
| 14. |
Chris Holden |
RED |
1
|
1
|
1.00
|
| 15. |
Rich Garcia |
BLUE |
1
|
1
|
1.00
|
| 16. |
Brandon Bailey |
BLUE |
1
|
1
|
1.00
|
| 17. |
Jimmy Moore |
BLUE |
3
|
1
|
0.33
|
| 18. |
Jon Potrzeba |
BLUE |
3
|
1
|
0.33
|
| 19. |
Jeff Deacon |
BLUE |
3
|
1
|
0.33
|
| 20. |
Jack Cross |
BLACK |
2
|
1
|
0.50
|
Back to Top Points
|
Players |
Team |
GP |
G |
A |
P |
P/GP |
| 1. |
Jeff Deacon |
BLUE |
3
|
10
|
1
|
11
|
3.67
|
| 2. |
Ian Soble |
BLACK |
3
|
2
|
3
|
5
|
1.67
|
| 3. |
Nate Christman |
BLACK |
3
|
2
|
3
|
5
|
1.67
|
| 4. |
Tommy Elsmon |
BLACK |
3
|
2
|
2
|
4
|
1.33
|
| 5. |
Jacob Hoberman |
BLUE |
3
|
0
|
4
|
4
|
1.33
|
| 6. |
Josh Heyka |
BLACK |
3
|
1
|
2
|
3
|
1.00
|
| 7. |
Jason Tehranisa |
BLACK |
3
|
2
|
1
|
3
|
1.00
|
| 8. |
Jon Potrzeba |
BLUE |
3
|
2
|
1
|
3
|
1.00
|
| 9. |
Dan Brown |
BLUE |
3
|
0
|
3
|
3
|
1.00
|
| 10. |
Jack Cross |
BLACK |
2
|
2
|
1
|
3
|
1.50
|
| 11. |
Andrew Haffner |
YELLOW |
1
|
2
|
0
|
2
|
2.00
|
| 12. |
Angelo Nero |
RED |
1
|
0
|
2
|
2
|
2.00
|
| 13. |
Brandon Bailey |
BLUE |
1
|
1
|
1
|
2
|
2.00
|
| 14. |
Charles Huse |
RED |
1
|
2
|
0
|
2
|
2.00
|
| 15. |
Justin Vance |
RED |
1
|
1
|
1
|
2
|
2.00
|
| 16. |
Ryan Halpin |
BLACK |
1
|
0
|
1
|
1
|
1.00
|
| 17. |
Taylor Jacobs |
BLACK |
3
|
1
|
0
|
1
|
0.33
|
| 18. |
Brandon Henning |
GREEN |
1
|
1
|
0
|
1
|
1.00
|
| 19. |
Monica Korzon |
GREEN |
1
|
0
|
1
|
1
|
1.00
|
| 20. |
Andrew Wisniewski |
GREEN |
1
|
1
|
0
|
1
|
1.00
|
| 21. |
Brian O'Neill |
GREEN |
1
|
0
|
1
|
1
|
1.00
|
| 22. |
Brian Bradley |
WHITE |
1
|
0
|
1
|
1
|
1.00
|
| 23. |
Joey Morford |
WHITE |
1
|
1
|
0
|
1
|
1.00
|
| 24. |
Sean Collings |
YELLOW |
1
|
0
|
1
|
1
|
1.00
|
| 25. |
Mark Knaus |
BLACK |
2
|
1
|
0
|
1
|
0.50
|
| 26. |
Sub #28 |
BLUE |
1
|
1
|
0
|
1
|
1.00
|
| 27. |
Sub #14 |
BLUE |
1
|
1
|
0
|
1
|
1.00
|
| 28. |
Jimmy Moore |
BLUE |
3
|
0
|
1
|
1
|
0.33
|
| 29. |
Matt Colclough |
BLACK |
1
|
1
|
0
|
1
|
1.00
|
| 30. |
Mark Wilson |
BLUE |
3
|
1
|
0
|
1
|
0.33
|
Back to Top
Shots On Goal
|
Players |
Team |
GP |
S |
S% |
S/GP |
| 1. |
Jeff Deacon |
BLUE |
3
|
20
|
0.500
|
6.67
|
| 2. |
Nate Christman |
BLACK |
3
|
17
|
0.118
|
5.67
|
| 3. |
Jason Tehranisa |
BLACK |
3
|
16
|
0.125
|
5.33
|
| 4. |
Ian Soble |
BLACK |
3
|
15
|
0.133
|
5.00
|
| 5. |
Matt Colclough |
BLACK |
1
|
12
|
0.083
|
%12.00
|
| 6. |
Jack Cross |
BLACK |
2
|
12
|
0.167
|
6.00
|
| 7. |
Jon Potrzeba |
BLUE |
3
|
10
|
0.200
|
3.33
|
| 8. |
Mark Wilson |
BLUE |
3
|
9
|
0.111
|
3.00
|
| 9. |
Tommy Elsmon |
BLACK |
3
|
8
|
0.250
|
2.67
|
| 10. |
Josh Heyka |
BLACK |
3
|
8
|
0.125
|
2.67
|
| 11. |
Dan Bacon |
BLUE |
3
|
8
|
0.000
|
2.67
|
| 12. |
Dan Brown |
BLUE |
3
|
8
|
0.000
|
2.67
|
| 13. |
Mark Grey |
BLUE |
3
|
7
|
0.143
|
2.33
|
| 14. |
Jacob Hoberman |
BLUE |
3
|
7
|
0.000
|
2.33
|
| 15. |
Brandon Bailey |
BLUE |
1
|
7
|
0.143
|
7.00
|
| 16. |
Brian O'Neill |
GREEN |
1
|
7
|
0.000
|
7.00
|
| 17. |
Karen Lingas |
BLUE |
3
|
5
|
0.000
|
1.67
|
| 18. |
Brandon Henning |
GREEN |
1
|
5
|
0.200
|
5.00
|
| 19. |
Andrew Wisniewski |
GREEN |
1
|
5
|
0.200
|
5.00
|
| 20. |
Taylor Jacobs |
BLACK |
3
|
5
|
0.200
|
1.67
|
Back to Top
Penalty Minutes
|
Players |
Team |
GP |
PIM |
PIM/GP |
| 1. |
Wiley Miller |
GREEN |
1
|
4
|
4.00
|
| 2. |
Dan Bacon |
BLUE |
3
|
4
|
1.33
|
| 3. |
Mark Grey |
BLUE |
3
|
4
|
1.33
|
| 4. |
Jacob Hoberman |
BLUE |
3
|
4
|
1.33
|
| 5. |
Josh Heyka |
BLACK |
3
|
2
|
0.67
|
| 6. |
Ian Soble |
BLACK |
3
|
2
|
0.67
|
| 7. |
Mike Fellenbaum |
GREEN |
1
|
2
|
2.00
|
| 8. |
Brandon Henning |
GREEN |
1
|
2
|
2.00
|
| 9. |
Tommy Elsmon |
BLACK |
3
|
2
|
0.67
|
| 10. |
Evan Nolan |
WHITE |
1
|
2
|
2.00
|
| 11. |
Jeff Hindulak |
RED |
1
|
2
|
2.00
|
| 12. |
Jon Potrzeba |
BLUE |
3
|
2
|
0.67
|
| 13. |
Sumit Sharma |
BLUE |
1
|
2
|
2.00
|
| 14. |
Sub #28 |
BLUE |
1
|
2
|
2.00
|
| 15. |
Nate Christman |
BLACK |
3
|
2
|
0.67
|
| 16. |
Jack Cross |
BLACK |
2
|
2
|
1.00
|
Back to Top Hat Tricks
|
Players |
Team |
GP |
HT |
HT/GP |
| 1. |
Jeff Deacon |
BLUE |
3
|
3
|
1.00
|
Back to Top Playmakers
|
Players |
Team |
GP |
PM |
PM/GP |
| 1. |
Ian Soble |
BLACK |
3
|
1
|
0.33
|
| 2. |
Jacob Hoberman |
BLUE |
3
|
1
|
0.33
|
Back to Top
Goals Against Average
|
Players |
Team |
GP |
GA |
GAA |
| 1. |
Wes Deacon G |
BLUE |
3
|
5
|
1.67
|
| 2. |
Grant Passell G |
BLACK |
3
|
12
|
4.00
|
| 3. |
Dave Kresnye G |
GREEN |
1
|
4
|
4.00
|
Back to Top Shutouts
Back to Top
Goalie Winning %
|
Players |
Team |
GP |
W |
L |
T |
PCT |
| 1. |
Wes Deacon G |
BLUE |
3 |
3 |
0 |
0 |
1.000
|
| 2. |
Grant Passell G |
BLACK |
3 |
2 |
1 |
0 |
0.667
|
Back to Top
Saves per Game
|
Players |
Team |
GP |
SV |
SV/GP |
| 1. |
Wes Deacon G |
BLUE |
3
|
91
|
30.33
|
| 2. |
Pete Ehlers G |
RED |
1
|
26
|
26.00
|
| 3. |
Yi Wang G |
YELLOW |
1
|
25
|
25.00
|
| 4. |
Frank Theiss G |
WHITE |
1
|
25
|
25.00
|
| 5. |
Grant Passell G |
BLACK |
3
|
74
|
24.67
|
| 6. |
Dave Kresnye G |
GREEN |
1
|
16
|
16.00
|
Back to Top
Save Percentage
|
Players |
Team |
GP |
SV |
Shots |
SV% |
| 1. |
Wes Deacon G |
BLUE |
3
|
91
|
96
|
0.948
|
| 2. |
Grant Passell G |
BLACK |
3
|
74
|
86
|
0.860
|
| 3. |
Yi Wang G |
YELLOW |
1
|
25
|
30
|
0.833
|
| 4. |
Frank Theiss G |
WHITE |
1
|
25
|
31
|
0.806
|
| 5. |
Dave Kresnye G |
GREEN |
1
|
16
|
20
|
0.800
|
| 6. |
Pete Ehlers G |
RED |
1
|
26
|
34
|
0.765
|
Back to Top
League Player of the Week
|
Player: Jeff Deacon
Team: BLUE |
|
Categories |
Statistics |
| 1. |
Games Played |
3 |
| 2. |
Goals Scored |
10 |
| 3. |
Assists |
1 |
| 4. |
Penalty Minutes |
0 |
| 5. |
Shots on Goal |
20 |
| 6. |
Hat Tricks |
3 |
| 7. |
Playmakers |
0 |
| 8. |
Shutouts |
0 |
| 9. |
Wins |
0 |
| 10. |
Ties |
0 |
| 11. |
Saves |
0 |
| 12. |
Save Percentage |
0.000
|
THIS WEEK'S PLAYER OF THE WEEK NUMBER IS 66 .
Back to Top
Game Results For The Season
| BLUE |
| | DATE | Opponent |
Score |
H/A |
W/L |
| 1. |
6/ 2
|
WHITE
|
6
- 1
|
Away
|
W |
| 2. |
6/ 4
|
YELLOW
|
5
- 2
|
Away
|
W |
| 3. |
6/ 9
|
BLACK
|
6
- 2
|
Away
|
W |
| BLACK |
| | DATE | Opponent |
Score |
H/A |
W/L |
| 1. |
6/ 2
|
RED
|
8
- 4
|
Home | W |
| 2. |
6/ 6
|
GREEN
|
4
- 2
|
Away
|
W |
| 3. |
6/ 9
|
BLUE
|
2
- 6
|
Home | L |
| GREEN |
| | DATE | Opponent |
Score |
H/A |
W/L |
| 1. |
6/ 6
|
BLACK
|
2
- 4
|
Home | L |
| WHITE |
| | DATE | Opponent |
Score |
H/A |
W/L |
| 1. |
6/ 2
|
BLUE
|
1
- 6
|
Home | L |
| YELLOW |
| | DATE | Opponent |
Score |
H/A |
W/L |
| 1. |
6/ 4
|
BLUE
|
2
- 5
|
Home | L |
| RED |
| | DATE | Opponent |
Score |
H/A |
W/L |
| 1. |
6/ 2
|
BLACK
|
4
- 8
|
Away
|
L |
Back to Top
ANY CORRECTIONS CONTACT US AT 216-382-4872 or VBENANDER@bgsd.COM
|